Structural information about molecules (for example, degree of crystallinity vs. amorphous materials, the amount of solid vs. liquid, or the ratio of different crystalline forms) is particularly important in both the chemical and pharmaceutical industries both for process monitoring and for quality control and assurance (QC/QA). For example, many common drugs, such as acetaminophen, can crystallize in different forms (polymorphs) where each may have different uptake rates (effective dosing) in the body. And, even common chemicals like sulfur can solidify in multiple forms (for example, amorphous and crystalline), with different reactivity.
The traditional method of obtaining some structural information is x-ray diffraction (XRD), but this laboratory technique can’t be used directly for in-line process monitoring. And even for captured samples, XRD has difficulty quantifying small amounts of crystalline content in the presence of amorphous material that induces a strong background. In contrast, a simple analysis using vibrational spectroscopy of the low-energy modes that result from crystal lattice vibrations can be used to quantify the degree of crystallinity. These crystal lattice modes can only be detected at terahertz wavelengths in absorption spectroscopy, or by collecting signals with very small shifts from the laser line (<150 cm-1) for Raman spectroscopy.Since Raman spectroscopy is already widely used for chemical identification using visible lasers and silicon-based detectors, and generating and detecting terahertz waves has its own limitations in what types of materials can be measured, low-frequency Raman spectroscopy has some clear advantages. The challenge has always been to block the strong Rayleigh-scattered light well enough and still retain the low-wavenumber (low-frequency) signals. Now, the development of volume holographic gratings (VHGs) with extremely narrow spectral bandwidth extends the capabilities of Raman spectrometers based on visible lasers into the traditionally “difficult” terahertz vibrational energy domain of Raman.
A new type of terahertz-Raman instrumentation uses these VHG filters to simultaneously collect both the low-wavenumber structural-fingerprint and traditional midrange chemical-fingerprint signals. Such instrumentation is now available as add-on modules configured for integration into a microscope and/or conventional Raman spectrometer.
Examining sulfur
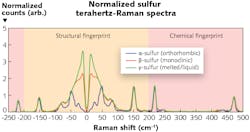
An example of the sensitivity to structural form is shown in the figure, highlighting a Raman spectrum of different mixed-phase samples of sulfur that includes the newly accessible terahertz frequency range, here enabled by a “TR-Probe” Raman module from Coherent (Santa Clara, CA). The midrange chemical-fingerprint region shows almost no differences between the samples, as they are all the same material (sulfur). However, the spectra vary dramatically in the terahertz range. Specifically, the liquid form of any material—in this case, γ-sulfur—delivers a broad so-called Boson peak. Forms with less long-range order—such as β-sulfur—produce a similarly broad peak, albeit with more features than the liquid signal, representing the short-range molecular order of the amorphous form. In contrast, the crystalline form (α-sulfur) has a terahertz spectrum consisting of multiple sharp peaks caused by low-frequency resonances in its extended lattice (corresponding to more long-range order).
“Even a cursory examination of a terahertz-Raman spectrum instantly tells you if the sample is highly crystalline or not,” says James Carriere, product line manager at Coherent. “While this could be rigorously quantified using simple chemometric fitting, that may not even be necessary. The crystalline peaks are so universally sharp compared to the broad Boson feature that it is often possible to accurately quantify the degree of crystallinity simply from analysis of the spectral derivative (slope) in the low frequency region.” Carriere adds that currently, most of the applications interest is coming from pharmaceutical companies, either to monitor polymorphs during the formulation process or for QC/QA of raw materials and final product. Certifying the polymorphic form of an active ingredient is critical to determining its efficacy and compliance with the U.S. FDA-approved form.

